
The Cortes Community Mapping Project recently launched its Cortes Island Map Series in Linnaea’s Lakeview Room. This morning’s program consists of gleanings from the three speakers: Sabina Leader Mense, David Shipway and Eve Flager.
Sabina Leader Mense: “I want to give you a little bit of background on how we got this project started. In a nutshell, the project is best described as putting community maps into community hands. That’s been our goal. I’m just one of the team members working on this project.
Eve Flager, whom you’ll be hearing from shortly, is our GIS (Geographic Information System) analyst. David Shipway is the keeper of maps on Cortes and has been a big part of this project. Sonya Friesen, ground-truther extraordinaire, has been working with us. Maya Buckner, who is not here, was born and raised on Cortes and is a newly accredited GIS analyst through Vancouver Island University. So we have our own resident analyst mentored by Eve. We’re in a really good position to move forward with our maps.
I’ve always loved maps, as I’m sure many of you have. In 2000, I was involved in my very first official mapping project, which was the Islands In The Salish Sea. We produced a community atlas—I hope some of you have seen it. That was a fun project. What I carried away from that project was a quote by Briony Penn, a biogeographer and one of the instigators of that project: “Whoever has the maps in their hands controls the fate of the land.” That really resonated with me in terms of controlling the fate of our lands here on Cortes Island.
That same year, in 2000, I mapped the occurrence of eelgrass around Cortes Island. A couple of months later, the provincial government announced a provincial review of the shellfish leases for the Baynes Sound, Cortes Island, and Okeover Inlet areas. They arrived in Gorge Harbour with all their maps to prove they were doing a due-diligence, ecosystem‑informed planning process.
I had my new chart, annotated with the occurrence of eelgrass, under my arm and went to see their maps. I asked to see the marine resources (where the eelgrass would be) and was directed to a table with a big map on it and a smiling face behind it. I said, “I’d like to see eelgrass.”
He said, “This is the master map of marine resources of Cortes Island.” There were a couple of occurrences of herring spawn, a couple of kelp beds noted that were long since gone—and there was no eelgrass on that map. I looked up at the young fellow representing the government and said, “Eelgrass must be on a different map.”
He said, “Oh no, this is the master map of marine resources for Cortes Island, and if you don’t see any eelgrass on this map, you don’t have any eelgrass.”
I said, “Really?” as I rolled out my new chart with all the eelgrass occurrences on it.
That was my first introduction to the government’s map. Later that same year, the regional district asked for that eelgrass occurrence so they could digitize it to support an ecosystem‑informed planning process on their end. They digitized it.
Several years later, somebody asked me for a digital copy of that information. I went to the Strathcona Regional District and asked, “Could we have a copy so we can pass it along to people?” They said, “Sure.”
They couldn’t find it. They remembered digitizing it, but they somehow lost it in the transition from the Comox Strathcona Regional District into the two separate regional districts: the Strathcona Regional District (SRD) and Comox Valley Regional District (CVRD). I have the hard copy, but they lost our data.
I kept thinking again about what Briony had said: whoever has the maps in their hands controls the fate of the land. I kept thinking we need to have our own maps. In 2013, I got involved in a project called the Discovery Islands Ecosystem Mapping Project, based on Read Island. That’s where Eve Flager and I met. She was a Read Islander, and I was consulting on producing educational material around sensitive ecosystem inventory mapping that Eve was conducting at the time.
I kept up with some of the work Eve was doing. In 2022, Eve was producing the Read Island Protected Landscape Network map and empowering her home community of Read Island to have their own maps. I remember looking at Eve and asking, “Can you do that for Cortes as well?” She said, “Why not? Right? Why not?” So in May 2022, I had Eve quickly pull a budget together for what that might cost. I sent that proposal to the Friends of Cortes Island Society. They spent a year ruminating on it and didn’t come up with any financial resources.
In June 2023, I decided to cast the net a little further and sent the invitation to support this project to the Cortes Community Economic Development Association (CCEDA), Community Housing Society, Cortes Community Forest Committee, Cortes Island Community Foundation, Friends of Cortes Island Society, Strathcona Regional District, and the Cortes Land Conservancy Working Group that I was working with at the time.
2023: absolute silence for a year. I came back to it in April 2024, had Eve pare that budget down to the absolute nubs, and sent it out again to that same circle of people. Luckily for us, two agencies had funds in place that they were willing to dedicate to the project: the Cortes Community Forest Cooperative, which David was heading up at the time, and the Cortes Housing Society, which Sadhu Johnston was heading up at the time. Thanks to those two community agencies, we had the money to give Eve the go‑ahead to start.
Those two agencies put up the money for these maps. They do not own the maps. They provided the funds so that the community owns them. They belong to every one of us in the community. Eve started tackling maps #1 through #6 in early 2024, and she tapped into updated government data—so what you’re seeing on maps #1 through #5 is all government data. That is the most up‑to‑date information they have. It’s important that we start with base maps based on government data so our maps actually talk to each other. That’s incredibly important.
But there’s something really important for everyone to understand: maps #1 through #5 come with a large number of errors and omissions. It doesn’t take long to sit down with one of those maps and go, “Wait a minute—that doesn’t work.” Several people have come to me and said, “Wait a minute, this is missing.” The point is, with the creation of these five maps, Eve has positioned us in the starting box. The project can now begin. When we address all the errors and omissions, layer in our local ecological and cultural knowledge, and get these maps up to date with our own information, we’ll have something we’ve never had before: our own maps with all the information in one place. This is a very exciting place to start. In the discussion after Eve’s presentation, I’d like to talk a bit about what that might look like.
I personally think we should start a mapping committee in the community to decide on the provincially standardized protocols we’ll adopt, to make sure our information is scientifically defensible, corrected in the appropriate ways, and can be properly layered onto the maps. There would be clear guidance for every person who wishes to contribute: everyone is welcome to do that, but contributions would follow a protocol so they can be appropriately layered onto the maps. That’s a discussion I hope will be ongoing in the community. David, keeper of the maps, comments on maps #1 through #6.
David Shipway: My focus was to make sure the human infrastructure being created on Cortes was included in our ecosystem maps, because humans are a big part of it. It wasn’t something we really got into when we did the Silva mapping in the 1990s, because we were mostly focused on forestry issues and trying to get a community forest. That has all happened. It’s more about looking at everything at once and seeing how it all fits together.
Back when we started, you’d go down to Maps BC in Victoria, look through the archives, find a paper topographic sheet of Cortes Island, and get them to print you a copy. It was all in 50‑foot contours; then everything went metric, and we had David Hughes take it to GSC Computers in Alberta to digitize the whole thing and convert it to metric contours. That’s what we started with for terrain, and we just kept going from there.
A lot of the Silva mapping was very generalized—just seat‑of‑the‑pants kind of stuff. I think we’ve got something here we can start with that’s far more accurate. Even though it has all these little layers in it, it’s still the base map—a huge jump forward.

Sabina Leader Mense: We all feel greatly empowered—and really excited—to have these maps in community hands; they are excellent base maps to build on.
One of the first additions to the freshwater resources map will be the Cortes Housing Society’s recent aquifer study. All of that information can now remain in the community on a map that is available to everyone.
It’s incredibly empowering to have our own maps, in an up-to-date format that allows us to enter information and move forward. That’s maps #1 through #5. There are six maps in the series. For the sixth map, David and I decided we couldn’t have a map series of the island without including Hans Trenton’s geological map, which he created for us years ago. It was produced with his Geological Survey of Canada expertise. However, it was never digitized, so Eve undertook that work for us; it is now a georeferenced map that’s part of the set (maps #1 through #6. Then we asked Eve to create map #7.
In my opinion, map #7 is the most exciting. It’s not at the back—we left it there until Eve had a chance to talk about it, and her presentation is map #7. I think map #7 shows the potential of how maps #1 through #6 can be used when you apply a specific lens for a specific purpose. We asked Eve to apply a lens of landscape connectivity and focus it on the maps to address: (1) landscape fragmentation and (2) the loss of biodiversity and ecosystem integrity. Map #7 shows us the potential of what we can do now that we have these base maps—and which lenses we may want to apply.
This is how we can address issues that matter to us across our different areas of expertise on the island. Connectivity conservation is the most progressive science dealing with landscape-level change during accelerating climate change. The International Union for Conservation of Nature (IUCN) has been promoting connectivity conservation for more than two decades, so it is still relatively new. They have a specialist group dealing with conservation connectivity, and they define connectivity conservation as the actions of individuals, communities, institutions, and businesses to maintain, enhance, and restore ecological flows, species movements, and dynamic processes across intact and fragmented environments. Moreover, it is an innovative strategy that is bringing together a growing global movement to protect the vital interconnections of nature by providing a coordinated response for safeguarding biodiversity and increasing resilience to climate change. This focus on connectivity conservation is happening at a global level.
The United Nations Convention on Biological Diversity (CBD) has been a major driver of connectivity conservation in policy formation, and the United Nations Convention on the Conservation of Migratory Species of Wild Animals (CMS) has adopted a formal definition of ecological connectivity that emphasizes the unimpeded movement of species and the flow of natural processes that sustain life on Earth. These bodies are major partners in advancing connectivity conservation in policy and practice around the world. This is exciting and new—which is why we asked Eve to work with maps one through six and create map #7: HLN, the Habitat Landscape Network.
Eve will explain how she used her GIS expertise to do that. I’m delighted to introduce Eve Flager—born and raised on Read Island, now living in Campbell River. Eve was formerly the GIS Technologist for the City of Campbell River. She now works independently as a GIS analyst and, luckily for us, had time to fit Cortes Island in and create these base maps for us.

Eve Flager: I worked with Speed, David, and a few others in the community to put together the Habitat and Linkage Network (HLN) within the Cortes Community Ecosystem Mapping Project.
Back in 2013, Lannie Keller and I were inspired to start ecosystem mapping for the Discovery Islands, and that mapping is still available at diemproject.org (the DIEM Project). We did SEI, terrain features, and watershed analysis. Then in 2020, Lannie connected with Herb Hammond, a forester‑ecologist, and they proposed creating a Protected Landscape Network (PLN) for Read Island. That’s when I began digging into the research and GIS tools needed to build something like that. Herb was the scientific expert on the project: I assembled the PLN, he reviewed it and provided feedback, and we iterated. He was instrumental in helping me develop this method for producing an ecological network.
Why create a Habitat and Linkage Network? The short answer is landscape connectivity. This is both an approach to conservation and a scientific concept. One common definition is the degree to which the landscape facilitates or impedes the movement of organisms among resource patches—determined by the interaction between landscape structure and species behaviour. Continuity in the landscape matters: maintaining and enhancing connectivity reduces the adverse effects of habitat loss and fragmentation. Ecological networks are a tool within the landscape‑connectivity approach; they help protect ecosystem continuity and function, recognizing that ecosystems don’t follow the borders we draw on maps and are influenced by adjacent lands. Looking at the landscape as a continuous flow of ecosystems helps ensure that when you protect an area, you actually maintain the integrity and purpose of that protection.

For example, if you protect a wetland but then develop in the uplands, you alter the hydrology and associated ecosystems—classic cumulative effects. An integrated approach to resource management must consider water, species and animal movement, and vegetation together.
Another benefit of working with networks is that they bring together diverse stakeholders, giving everyone a sense of ownership in the protected landscape network and fostering the kind of community stewardship needed to manage ecosystems over the long term.
In the recent past, conservation often focused on wildlife corridors—mostly linear routes between two protected areas, typically designed for a single focal species. With climate change, we’re seeing focal‑species distributions shift as ecosystems shift. The approach has evolved toward networks and linkages, particularly by using land facets—landscape units defined by specific topographic characteristics and soil traits. Examples include a high‑elevation, north‑facing slope with rocky soils, or a low‑elevation flat with deep soils. These topographic positions have distinct conditions that support particular communities of species. Including a representative set of land facets within the HLN helps meet conservation needs under climate change. There’s a strong body of science underpinning these approaches.

For the HLN on Cortes, we focused on two key habitat themes:
- Freshwater: wetlands and riparian areas (from SEI), which are foundational and often fragmented.
- Old forest: stands 140+ years old on medium‑ to high‑productivity sites (from VRI), which are both rare and ecologically important.
Links of Interest:
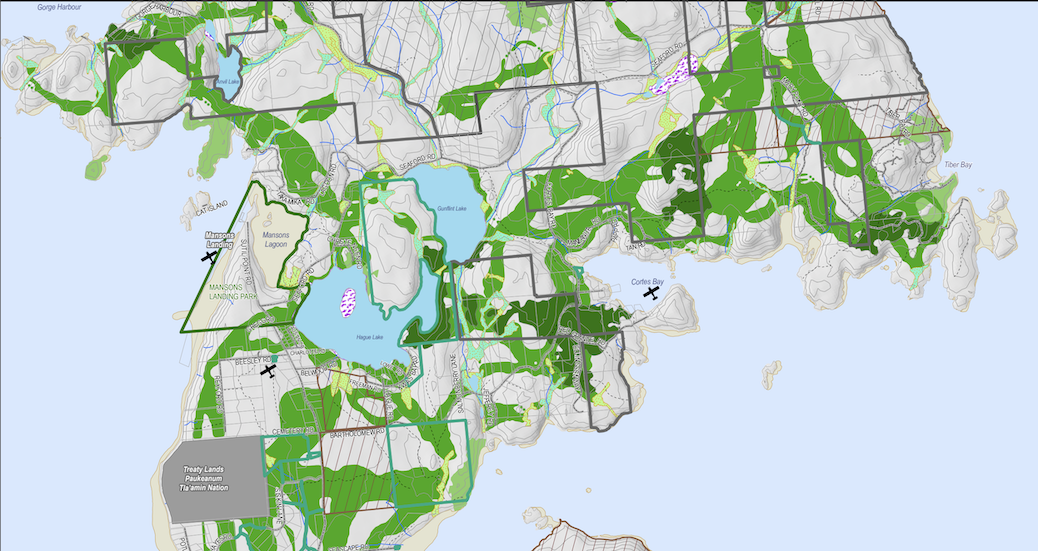
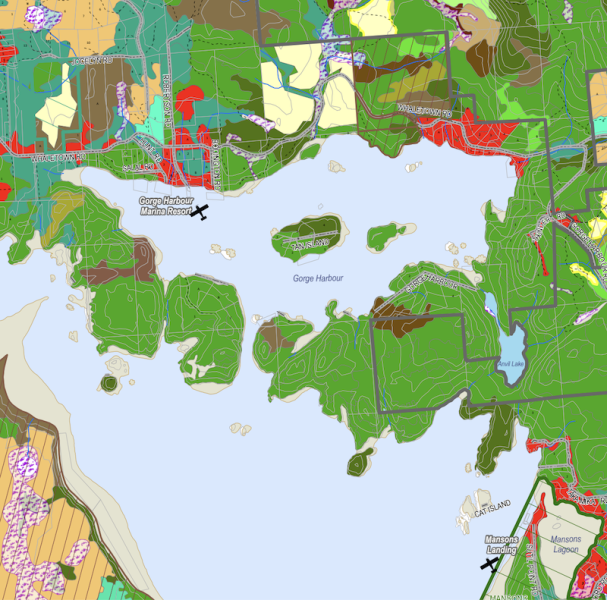
- Map 1 – Forested and Non-Forested Ecosystems
- Map 2 – Sensitive Ecosystems Inventory
- Map 3 – Fresh Water and Foreshore Ecosystems
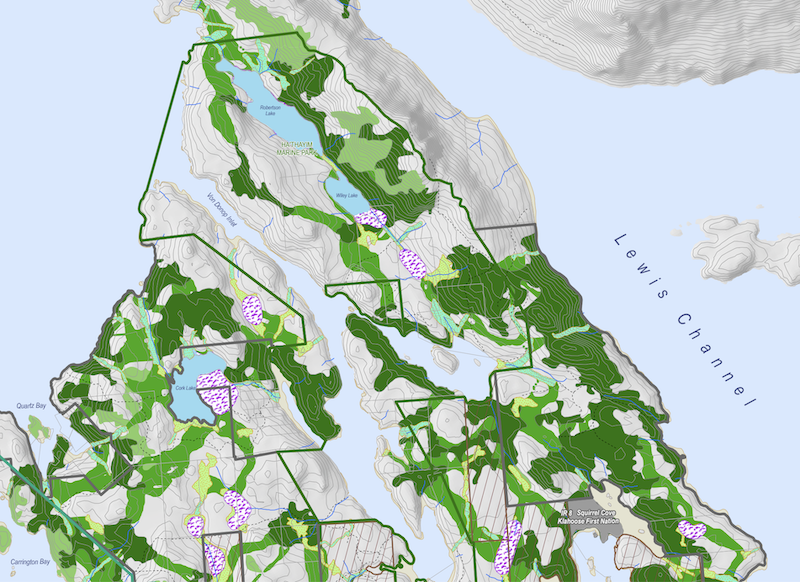
- Map 4 – Old Forest and Protected Areas
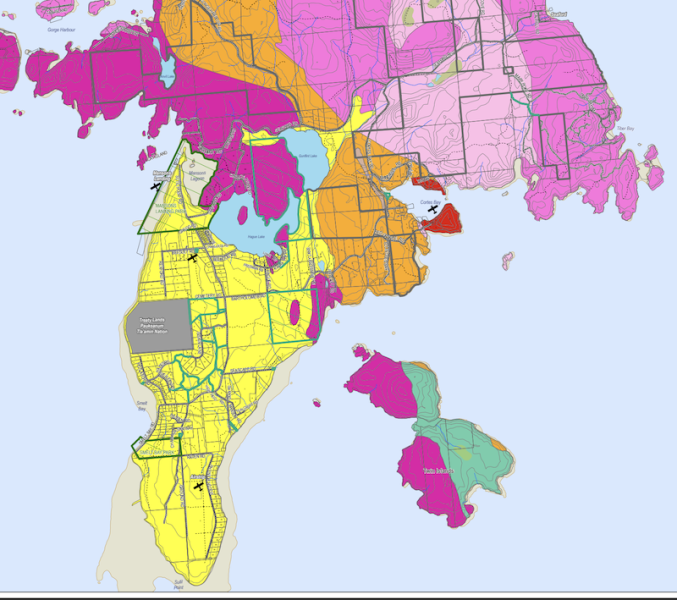
- Map 5 – Zoning and Current Development
- Map 6 – Geology
- Map 7 – Habitat Linkage Network
Sign-up for Cortes Currents email-out:
To receive an emailed catalogue of articles on Cortes Currents, send a (blank) email to subscribe to your desired frequency:
- Daily, (articles posted during the last 24 hours) – [email protected]
- Weekly Digest – [email protected]