

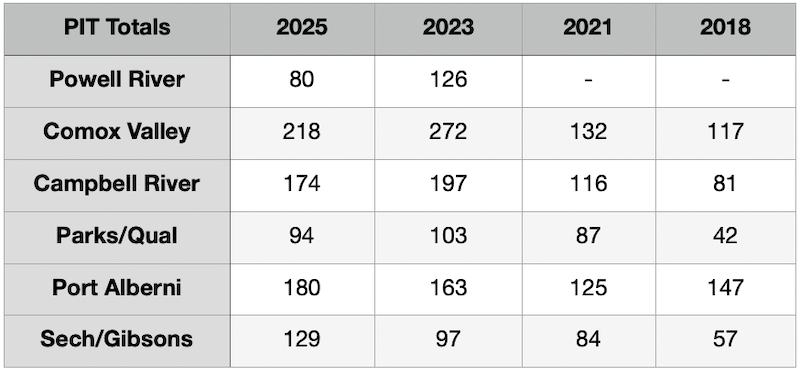
In 2025, the Province of British Columbia funded homeless counts in 20 communities. To virtually everyone’s surprise, the numbers were down in eight communities. Campbell River, Powell River, Comox and Parksville/Qualicum were among them. Port Alberni and Sechelt/Gibsons were not. In this morning’s broadcast, Cortes Currents looks into the reasons why, as well as some popular misconceptions and possible remedies about homelessness.
In her recent presentation to the city of Campbell River, Stephanie Hendrickson of the Strathcona Housing Alliance stated
“ I’m here to present the findings from the 2025 Point in Time (PIT) count, which happened on April 30th of this year. PIT counts are a snapshot of homelessness. They are done by surveying people in a 24 hour period. They are an accepted methodological tool used across the country. They look at demographics, characteristics, service use, and other information collected from people experiencing homelessness. They also track changes over time as communities regularly participate in them. Campbell River has had four now, other years include 2018, 2021, and 2023.”
Hendrickson explained the 12% drop in Campbell River’s homeless count, from 197 in 2023 to 174 this year, in terms of a 40 bed supportive housing complex called Homewood.
“ I absolutely believe that’s a big factor in why we saw a reduction. Once people are in Homewood, of course they’re not surveyed anymore because they’re not experiencing homelessness.”
She told the SRD’s Community Health and Wellness Committee, “The city, BC Housing and Lookout Housing should be applauded for opening Homewood because I don’t think we would’ve seen a drop at all. We would’ve seen an increase again, is my guess, had that facility not been opened.”
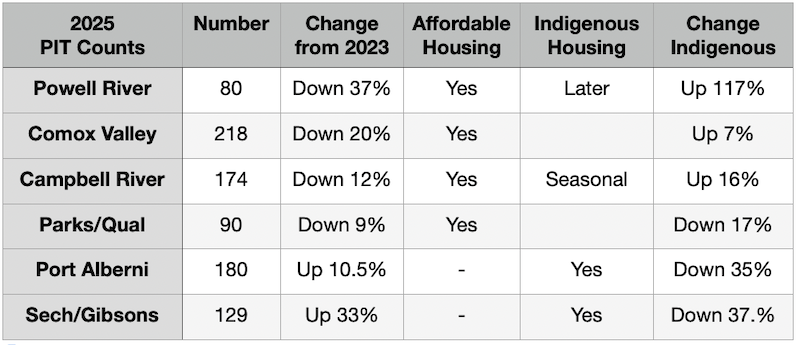
A quick Google search of the six communities mentioned above revealed that, between the 2023 and 2025 counts, affordable or supportive housing complexes were built in every one. However in Port Alberni and Sechelt/Gibsons, where the homeless numbers went up, they were specifically designed for, or by, First Nations.
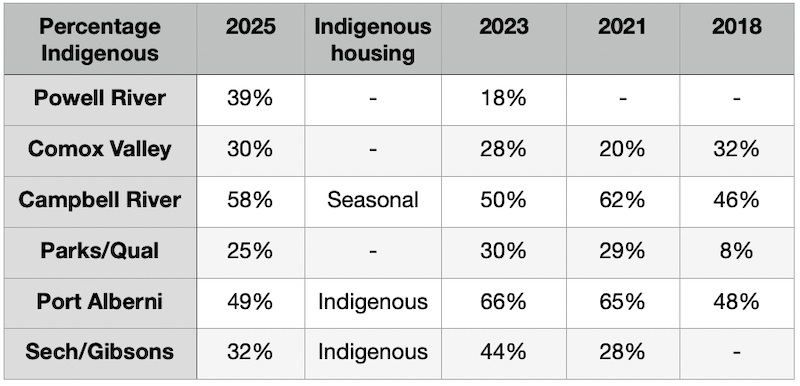
Thus while Port Alberni’s homeless numbers increased 10%, the Indigenous proportion dropped from 66% to 49%. This drop could be explained by the 48 unit Huupsitas affordable housing apartment building.
Similarly, the homeless count for the Sechelt/Gibsons rose 33%, but the Indigenous proportion dropped from 44% to 32%- probably because the shíshálh Nation opened a 34 unit affordable rental complex for Indigenous peoples.
Kim Markel, Executive Director of Lift Community Services, did not give the city an explanation for the 37% drop in Powell River’s homeless count.
“ Our count this year took place on Friday, March 7th, and this year we were able to connect with 80 individuals experiencing homelessness. This number is lower than the 126 identified in the 2023 count. We’re not the only community that saw a decrease in numbers compared to the last count. There were eight such communities across the province, but others like Campbell River for example, have had additional housing structures in place.”
She did not mention Powell River’s 24 unit Cranberry Place affordable housing complex, which opened six months after the city did its 2023 PIT Count.

Dayna Forsgren, with the Comox Valley’s Coalition to End Homelessness, told the CBC that the 20% drop in Comox’s PIT count might have come about through the area’s new affordable housing units.
There was a 9% drop in Parksville/Qualicuum, where a quick Google search found 87 and 50 unit affordable housing complexes opened between PIT counts.
So the counts in all six communities appear to have dropped, either overall or in regard to the Indigenous population, because of affordable housing projects.
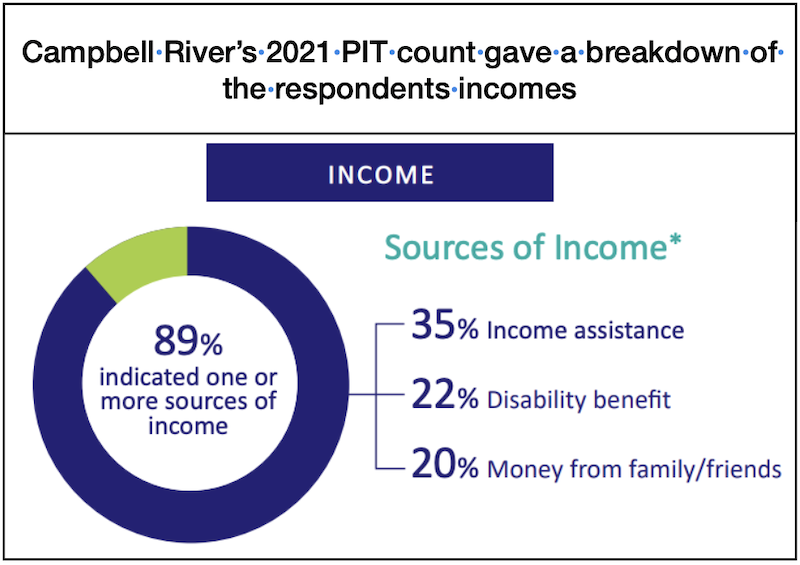
Depending on the community, between 78% and 82% of the respondents stated they received ‘income assistance.’ However, while preparing this story, Cortes Currents also looked at some of our province’s larger city’s PIT Counts. In Greater Victoria, that 80% figure appears to break down into 52% receiving disability pensions and 28% receiving welfare cheques.
While the specific numbers differ, much of what Lift’s Jessica Colasanta told the City of Powell applies to all six communities.
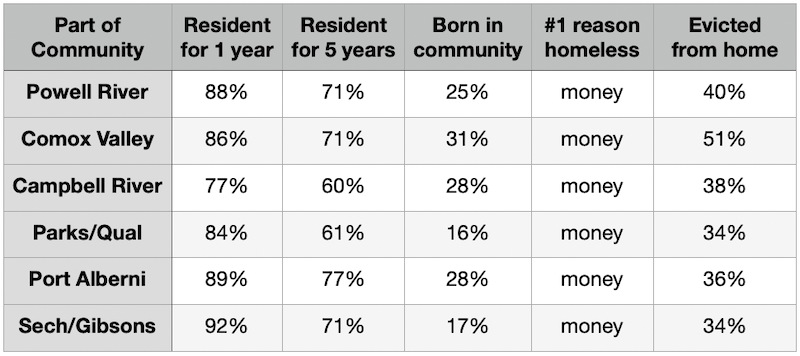
“More respondents are long-term local residents than short-term or transient residents. 71% were here five years or more. So we hope that this helps to dispel the unfounded rumours that people come to our community solely to access our housing services.”
“There’s a majority of people experiencing longer term homelessness. Most of these are unsheltered, meaning they’re not staying in a shelter. Note that this survey was taken while our emergency shelter was still open.”
Jessica Colasanta: “. . . Income remains the top reason for housing loss. This is the first year the count asked if someone’s most recent experience of homelessness was the result of an eviction. In our case, that was 40% of the respondents. Finally, the same as two years ago, food security services are the most accessed community support followed by our emergency room.”
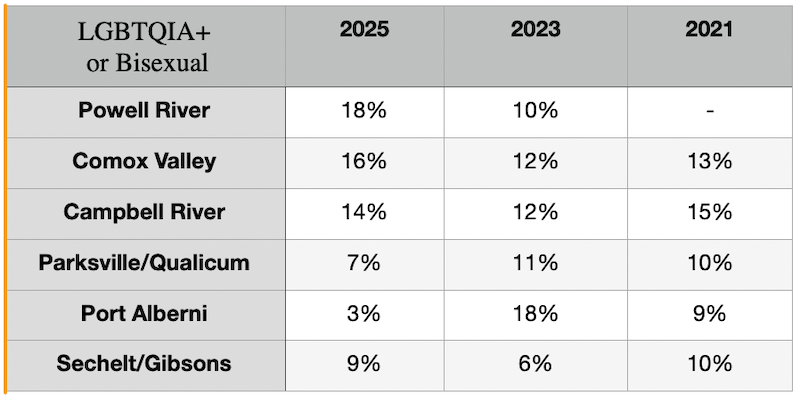
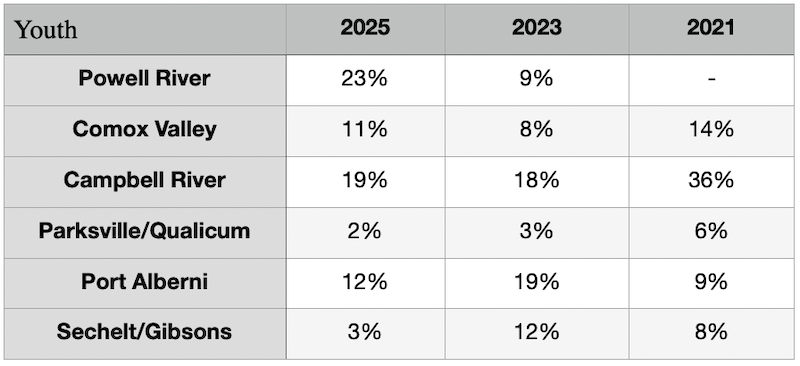
“There were differences primarily in demographics. In this year’s count, respondents identifying as Indigenous increased from 18% in 2023 to 39%, despite only accounting for 6% of the national census population. We saw youth respondents jump from 9% to 23%, and we saw an increase in individuals identifying as LGBTQIA+ from 10% up to 18%.”
Powell River was one of the two communities that reported an increase in the proportion of Indigenous homelessness.
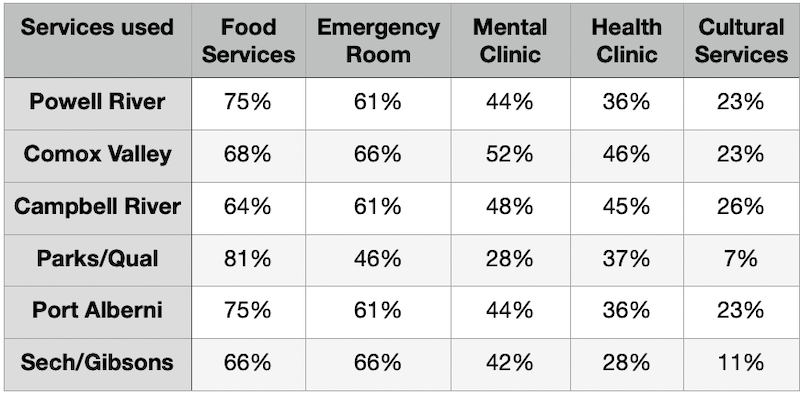
Without exception, the top two services respondents used were food and the emergency ward.
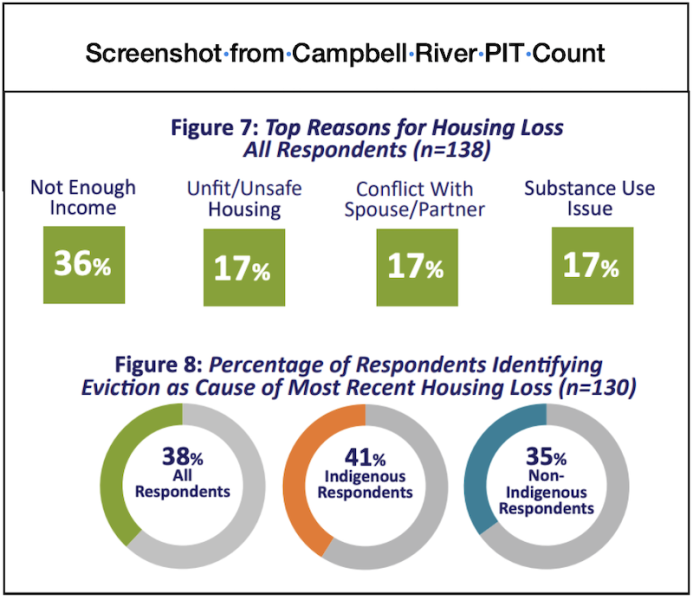
Without exception, the #1 explanation respondents gave for their homelessness was lack of sufficient income to pay rent. There were a variety of second choices, ranging from substance abuse to conflicts with partners, conflicts with landlords or unsafe housing.
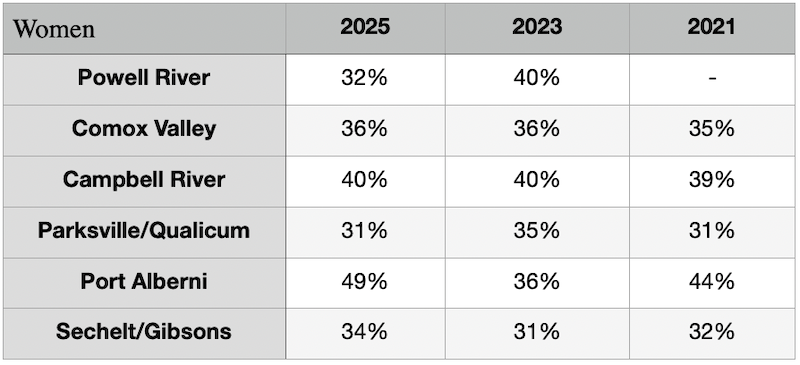
51% of respondents in the Comox Valley, 38% in Campbell River, 36% in Port Alberni, 34% in Sechelt/Gibsons and 34% in Parksville/Qualicuum mentioned being evicted from their homes.
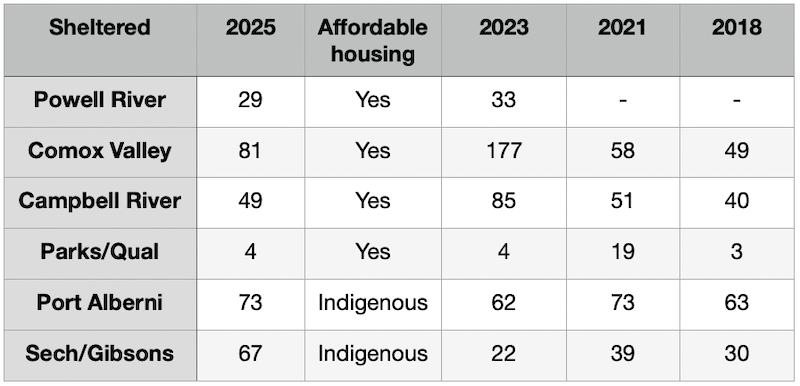
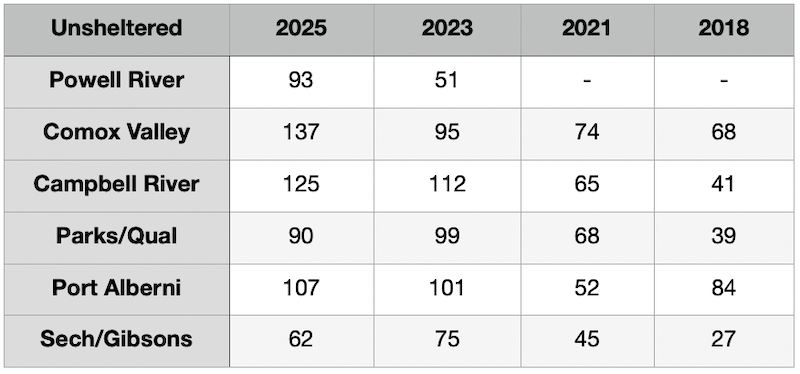
All six communities reported an increase in their unsheltered populations.
Hendrickson explained, “Sheltered is defined as staying overnight on the night of account in homeless shelters, transition houses, safe houses, or temporarily in hospital or jail. It specifically refers to places that are meant for temporary sheltering.”
“Unsheltered means staying outside in a vehicle or couch surfing. So while some of the people were sleeping in a place that technically provided shelter – I.E. couch surfing on the night of the count – they’re still considered unsheltered for these purposes because they weren’t in a designated place such as a shelter.”
“Of the 125 respondents experiencing unsheltered homelessness: 34% indicated that they were sleeping unsheltered in a public space; 29% were staying with others such as couch surfing; 18% were in a makeshift shelter, tent or encampment, and 16% were staying in vehicles.”
“We also asked people if they felt safe where they slept. There was a significantly greater feeling of safety for those who were couch surfing, followed by those who were in vehicles than those who were sleeping outside for safety reasons. Many people prefer couch surfing or being in a vehicle if they can find that option. If that is not available, some people report anecdotally that they prefer to either sleep in groups for protection, sleep near video cameras for security, or in hidden locations such as the forest. So they are more difficult to find.”
“You will notice that between 2023 and 2025, we had quite a drop in our sheltered number. I just received the raw data as we were sitting here this morning, so I haven’t had a chance to look yet exactly why that happened this year.”
“I think there are a few influencing factors that I can identify. Very simply, the weather was nice that day and many people might have been choosing to camp outdoors. That’s not an uncommon seasonal trend. While shelter numbers tend to stay fairly stable, generally they can fluctuate quite significantly on any given night in transition houses, particularly if there are no children with their caregivers on the night of the count and also in hospitals and in cells, and all of these were very low this year. Also the PIT count fell on Kwesa Place’s last day of seasonal shelter operation. The numbers were very low that night at that location, and that was likely due to the pending end of their season, and people having already adjusted their shelter use and anticipation of that.”
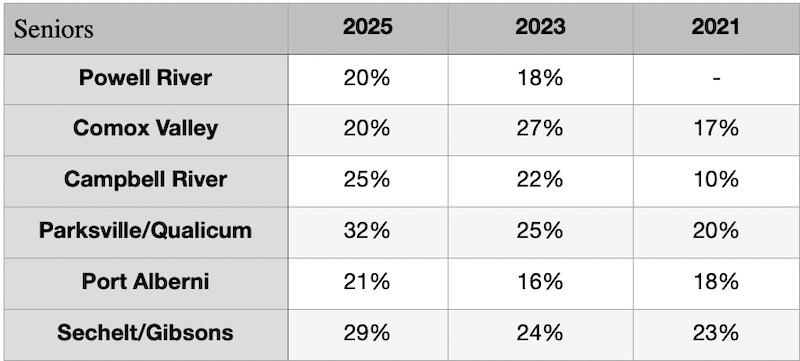
“A more nuanced consideration is that Campbell River tends to have a fairly high percentage of seniors, youth and women experiencing homelessness comparatively. So it’s possible that the community shelter services are not meeting the needs of these populations, and so the shelters are being underused.”
This may not be as applicable in rural areas, but 75% of the respondents in Greater Victoria had reservations about shelters. The most common concerns were safety and fear of ‘having their stuff stolen.’
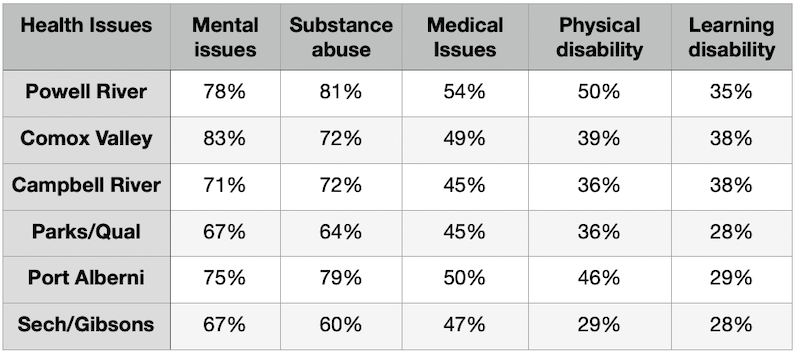
Significant numbers in all six communities were struggling with substance abuse, mental and/or medical health problems. For example: 83% of those in the Comox Valley had mental health issues and 38% had learning disabilities; In Powell River 81% were struggling with substance abuse and 54% with medical problems.
Hendrickson explained, “ People with poorer health are more likely to be unhoused and also chronic exposure to homelessness can worsen physical and mental health conditions.”
“Health challenges can be a significant barrier to accessing safe and stable housing. People experiencing homelessness have significant health issues and many have co-occurring health issues, such as combined mental health and substance use concerns. This leaves housing providers trying their best and sometimes accepting tenants that are not appropriate for their buildings simply because there is not another option for them.”
“In my professional opinion, housing is healthcare and we are not building housing that is responding to the significant health needs of the people who need it.”
“An interesting project out of Toronto last year, they built a 48 unit supportive housing building on hospital property. Researchers out of Ontario estimated that a month in hospital costs somewhere around $30,000, whereas a month in support housing costs around $4,000. They opened this new housing model in 2024 directly connecting people to housing as well as medical professionals. They selected 48 individuals who had been responsible for 2,000 emergency department visits the year before they moved in and those were their tenants. Between emergency visits in hospital stays the 48 patients had been responsible for $2.1 million in hospital costs over one year. One year after being housed in this new building, hospitals calculated a savings of $1.66 million compared to the year before from only those 48 patients alone.”
“So not only is housing the humane choice, it’s also the economical one. For Campbell River, 41% of our respondents to this year’s PIT count indicated that they had had a hospital stay in the past year. Many would’ve had multiple visits. People most commonly cited mental health and substance use concerns here in Campbell River. This was followed by a general medical condition, a disability related to the census, such as sight or hearing, a learning disability, a physical disability and then finally, a quarter of respondents indicated a brain injury that happened after birth.”
In her conclusion, Hendrickson stated, “I want to note a few limitations from Point in Time counts.”
“First of all, they are an undercount. They should be assumed to be minimums and not an accurate enumeration. Despite our best efforts, we cannot find everybody in a 24 hour period. However, by using the same methodology over multiple years, it starts to paint a picture over time and allows us to understand what might be anomalies and what might be trends.”
“Second, there are seasonal fluctuations in homelessness populations. This is especially true for communities like Campbell River that are the closest service and health hub for large rural and remote regions. The numbers that we see in April when we do a Point in Time count may be different from what we would see if we did one in the summer or the winter. However, to keep the methodology consistent, we do Point in Time counts around the same time each year.”
“Third, Point in Time counts are voluntary so people can choose which questions they do and do not respond to. We can’t force anybody to respond to a question, in that way we’re at a whim of how much a person wants to share, but it is one of the reasons that we use service and health providers and peers to help with surveying. It’s more likely that someone will share more with a person that they have a preexisting relationship with.”

“Another limitation is that certain demographics do tend to be underrepresented in Point in Time count data and this is due to how people experience homelessness. For example, women, youth and seniors would be more likely to try to stay hidden for safety reasons, due to increased vulnerability. They would be more difficult to enumerate. So due to these limitations, the power of PIT count really does come from doing them over multiple years to see trends, patterns, and changes over time.”
“It’s also important to look at complimentary sources of data, such as reports from service providers to help corroborate the findings. This is, of course, the work that the Strathcona Housing Alliance does as well, related to the findings from this year’s PIT count, I can say that I wasn’t terribly surprised about everything or about anything. Most of what we’re seeing is corroborated by what I’m hearing from service and health providers as well.”
Links of Interest:
- Homeless Counts funded by B.C. government (2020-2025) – BC Housing
- The #1 Cause of Homelessness – Cortes Currents
- Articles about, or mentioning, homelessness
- Homelessness on Cortes Island
- Homelessness on Quadra Island
Top image credit: Homeless man – Image by Brigitte Werner from Pixabay; graphs compiled by Roy L Hales using data from PIT Counts.
Sign-up for Cortes Currents email-out:
To receive an emailed catalogue of articles on Cortes Currents, send a (blank) email to subscribe to your desired frequency:
- Daily, (articles posted during the last 24 hours) – [email protected]
- Weekly Digest cortescurrents – [email protected]