

While the world has already reached the threshold of a 1.5°C increase in global temperatures, many scientists believe it is still possible to get back on track. According to the 2023 UN Emissions Gap Report, this would require a 42% cut in our emissions. It would take a 28% reduction to keep emissions below 2.0°C by the end of this century. A tool on the Berkeley Earth website shows each nation’s emissions in 2022, their current trajectory by 2100 and where it could be if all net zero pledges are met.

According to Berkeley Earth, the world’s worst emitter per capita is Qatar, which produces 38.8 tonnes of CO2 per person and there are 231 people per sq. km. It’s rise over average temperatures was already +2.1°C in 2022 and heading for around +4.5°C by the end of this century. The best case scenario is for Qatar to reduce its average temperature to +2.7°C by the end of this century.
The principle obstacle is that Qatar is the world’s leading LNG exporter and Qatar is strongly represented in almost every sector of the natural gas trade.
On its current trajectory, Qatar may reach net zero carbon emissions by 2196.

Viewed per capita, Australia (14.5 tonnes per capita), the United States (14.3) and Canada (14.0) have emissions that are around 3 times higher than the global average.
Despite its sparse population (4 people per sq km) and immense renewable potential, Canada’s average temperature is already +2.1°C over pre-industrial levels and heading for +5.2°C by the end of this century. The best-case scenario for Canada is currently +3.5°C.
According to the Government of Canada, close to a third (31%) of our emissions come from the fossil fuel sector and another 22% from fossil fuel powered transportation. This is liable to increase as the federal and provincial governments continue to encourage gas, oil and LNG projects.
In addition, the average Canadian has a lifestyle whose emissions are 6 times more than someone in a poor country like Indonesia.
Canadian consumers spent $1.6 trillion in 2022.
The recently published ‘1.5-Degree Lifestyles: Towards A Fair Consumption Space for All’ reported several areas where Canadians can improve their personal footprints:
- 35% of the average Canadian’s personal footprint comes from transportation, primarily by gas powered automobiles. We travel 15,500 km a year.
- The average Canadian home uses 11,480 kWh of energy per year.
- “The average Canadian has a food carbon footprint of 1,680 kg (CO₂e per year), of which meat products comprise 47% and dairy 20%.
However Canada should reach zero net carbon emissions by 2078.
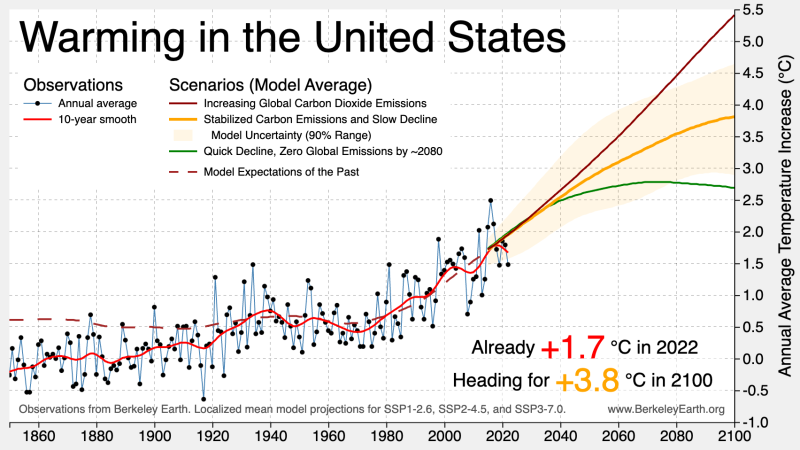
The United States average temperature was +1.7°C above pre industrial levels in 2022 and currently heading for around +3.8°C in 2100. The best scenario is for the US to limit this to +2.7°C.
According to the Environmental Protection Agency, It’s largest source of emissions is transportation, over 94% of which is petroleum based. The second largest is electricity, 60% of which comes from burning fossil fuels, mostly coal and natural gas.
America is the world’s biggest consumer nation and spent $21 trillion in 2022.
During the course of a year, the average American:
- travels 20,921 km,
- ate so much that approximately 41% of U.S. adults and over 20% of adolescents age 12-19 are obese.
- uses 12,325 kWh of electricity in their home
The United States is expected to reach net-zero emissions by 2072.
Around half of global emissions are produced in Asia.
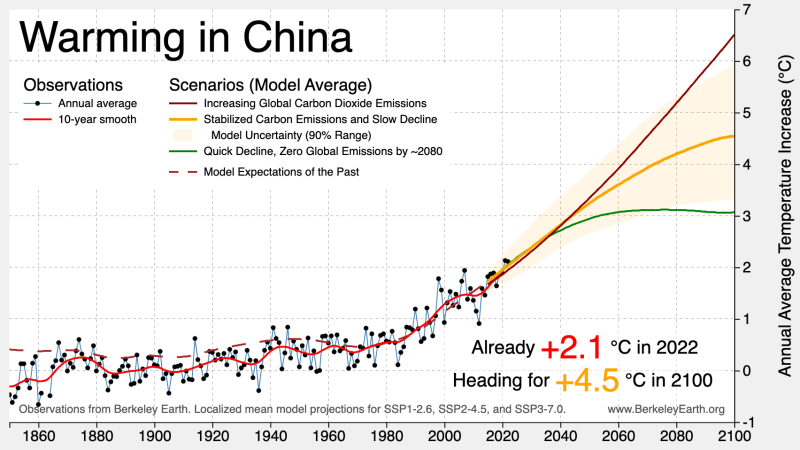
China is the world’s biggest emitter, producing 32.88% of the world’s emissions, but this nation is so large that there are only 151 people per sq km. Viewed per capita, Chinese emissions (8 tonnes per person) are currently a little more than half those of the United States.
China’s average temperature is already +2.1°C higher than pre-industrial levels and heading for 4.5°C by 2100. The best scenario for Chinese emissions is currently +3.1°C.
The principle obstacle to further reductions is its use of fossil fuels. Half of the world’s coal power plants are found in China. It is also responsible for 30% of Asia’s demand for gas since 2020. China is a major oil producer, but its energy needs are so high that it is also the world’s largest oil importer.
Chinese consumers spent $9.5 trillion in 2022.
According to the ‘1.5-Degree Lifestyles‘ report:
- The average Chinese resident consumes 1,320 kg (CO₂e per year), 39% of which consists of meat.
- They travel an average of 9,300 km, or roughly 60% of the Canadian rate.
- Their homes require about a sixth of the energy (1,870 kWh) of Canadian homes.
As China’s emissions are increasing 14% per year, there is no estimate for when it could reach net-zero carbon emissions.
Europe and the United Kingdom have done more to reduce their emission than any other part of the world.
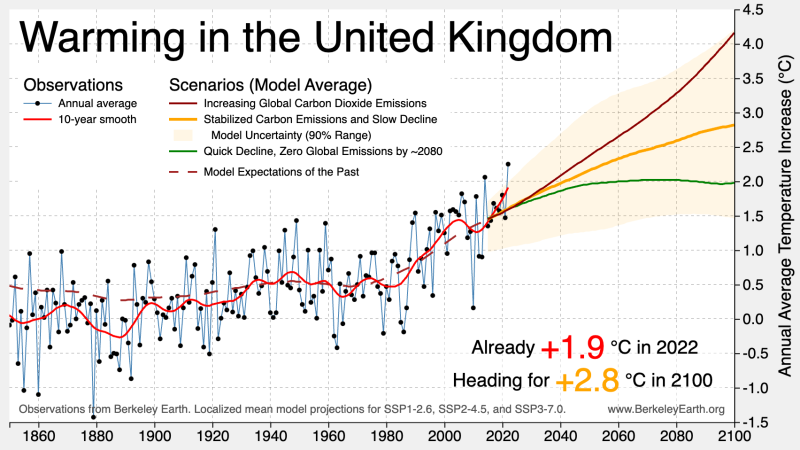
The United Kingdom’s emissions were +1.9°C in 2022 and heading for +2.8°C in 2100. Viewed per capita, Britain’s emissions (4.4 tonnes per person) are currently half those of China. The low emissions scenario in the chart above is +2.0°C by 2100, but the UK hopes to reach net-zero emissions by 2039 which makes +1.5°C possible.
Buildings (20.2) and transportation (29,1%) were the two largest contributors to the UK’s greenhouse gas emissions in 2023.
UK consumers spent $2.5 trillion in 2022.
The ‘1.5-Degree Lifestyles‘ report outlines a lifestyle approaching that of Canada :
- The average person in the UK uses 7,190 kWh of energy to heat their home, slightly more than half the Canadian total.
- They travel 14,700 km per person.
- The average person’s food footprint in the United Kingdom is 1,590 kg, 44% of which is meat (mostly beef).
The UK is expected to reach net-zero emissions by 2039.

Germany’s average temperature was +2.5°C above pre-industrial levels in 2022 and heading towards +3.8°C in 2100. If it achieves its goal of reaching net-zero carbon emissions by 2045, Germany may reduce its emissions to +1.5°C.
One of the principal challenges they need to overcome is a heavy reliance on fossil fuels such as coal, oil and natural gas for power generation or to fuel vehicles and machines.
German consumers spent $2.9 trillion in 2022.
During the course of a year, the average German:
- travels 13,602 km
- uses 6,091 kWh of energy to heat their home, less than half that of Canadian homes
- has a food footprint of 2300 kg per person per year
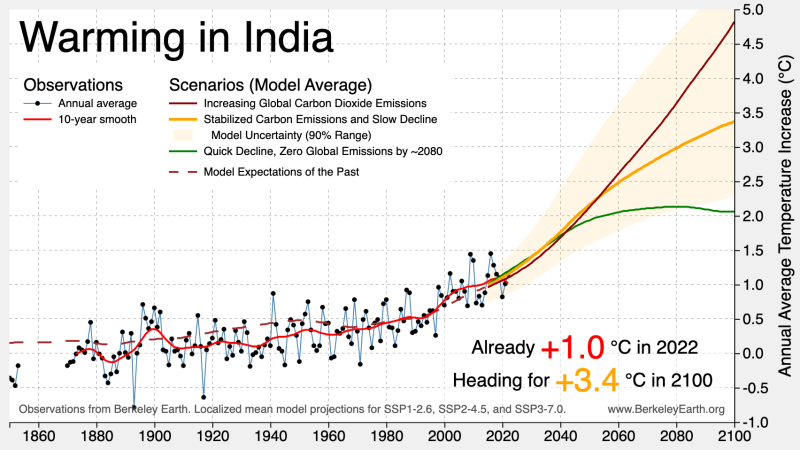
One of the reasons the world’s average temperature is only 1.5°C above pre-industrial levels is developing nations like:
- India, whose average temperature was only +1.0°C in 2022
- The Central African Republic was +1.3°C
- Mozambique was +1.4°C
However these are also nations whose emissions will dramatically increase as they obtain a larger share of the world’s resources.
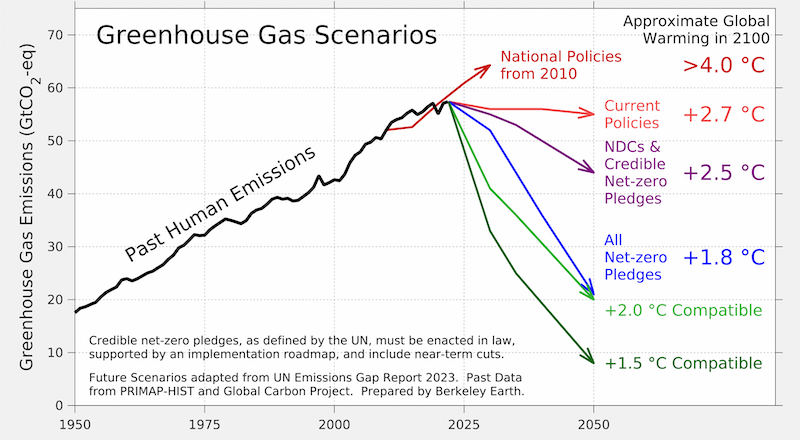
The scientists at Berkeley Earth expect the average global temperature to drop below 1.5°C in 2025 because we are entering a La Niña phase, but it may only take 5 years for our long-term trend to reach 1.5 °C. The world is currently on track to reach 4.0 °C, but if all net zero pledges are met it may be possible to hold the rise of global warming to 1.8 °C above pre-industrial levels.
“Recent warming trends and the lack of adequate mitigation measures make it clear that the 1.5 °C goal will not be met.”
According to the United Nations paper, The facts on climate and energy, fossil fuels are not clean sources of energy. Coal was responsible for 45% of the world’s carbon emissions from fuel combustion in 2020. Oil and natural gas trailed behind that at 32% and 22% respectively.
Natural gas produced 40 million tons of methane emissions, which are 84 times more potent than CO2 over a 20-year period.
There isn’t a nation on our planet that obtains 100% of its energy needs from renewables (hydro, geothermal, wind, solar etc) but there are nations who obtain 100% of their electricity. Close to 30 per cent of the world’s electricity currently comes from clean energy sources and by 2050 this number is expected to reach 90% by 2050.
“In most parts of the world, electricity from new renewable-energy plants, such as wind or solar, is now cheaper than power from new fossil fuel plants.”

Links of Interest:
- Berkeley Earth
- IPCC Sixth Assessment Report
- On the Threshold of a 1.5°C World – Cortes Currents
All charts courtesy Berkeley Earth; Top image credit: Qatar – Photo by Florian Wehde on Unsplash
Sign-up for Cortes Currents email-out:
To receive an emailed catalogue of articles on Cortes Currents, send a (blank) email to subscribe to your desired frequency:
Weekly Digest cortescurrents – [email protected]
Daily, (articles posted during the last 24 hours) – [email protected]